

Worldwide Import Data Analytics: Unlocking Global Trade Insights
2026-06-26
Every shipment tells a story, but without the right lens, those stories remain hidden in a sea of customs records. At Tendata, we transform raw trade data into clear, actionable insights—uncovering emerging markets, tracking competitor supply chains, and spotting shifts in global demand before they become headlines. This isn't just about numbers; it's about decoding the narrative behind every container, every buyer, every supplier. In this article, we'll explore how worldwide import data analytics rewrites the rules of global trade.
Decoding Trade Flows: The Hidden Signals in Import Data
Import data offers more than a tally of goods crossing borders; it’s a pulse check on economic health. When container volumes spike unexpectedly in niche sectors like specialty chemicals or precision instruments, it often foreshadows industrial expansions before official reports acknowledge them. Analysts who track these shifts can spot nascent demand curves months ahead of traditional indicators, turning customs records into a crystal ball for supply chain strategists.
Beyond volume, the composition of imports tells a story of shifting consumer values. A surge in second-hand machinery arriving at developing ports, for instance, may hint at informal sector growth that GDP calculations overlook. Similarly, a steady climb in ethically certified raw materials signals changing corporate priorities long before sustainability reports are published. These patterns, buried in shipping manifests, reveal where markets are truly heading—not where they claim to be.
Geopolitical ripples also surface in import data with remarkable clarity. When importers quietly reroute shipments through neutral transshipment hubs to avoid tariff barriers, the data exposes realignment months before policy shifts become public. Obscure trade lanes suddenly swelling in activity often trace back to sanctions evasion or regional realignments, making shipping schedules an unspoken diplomatic barometer for those who know how to decode the entries.
Beyond Tariffs: Uncovering Untapped Market Opportunities
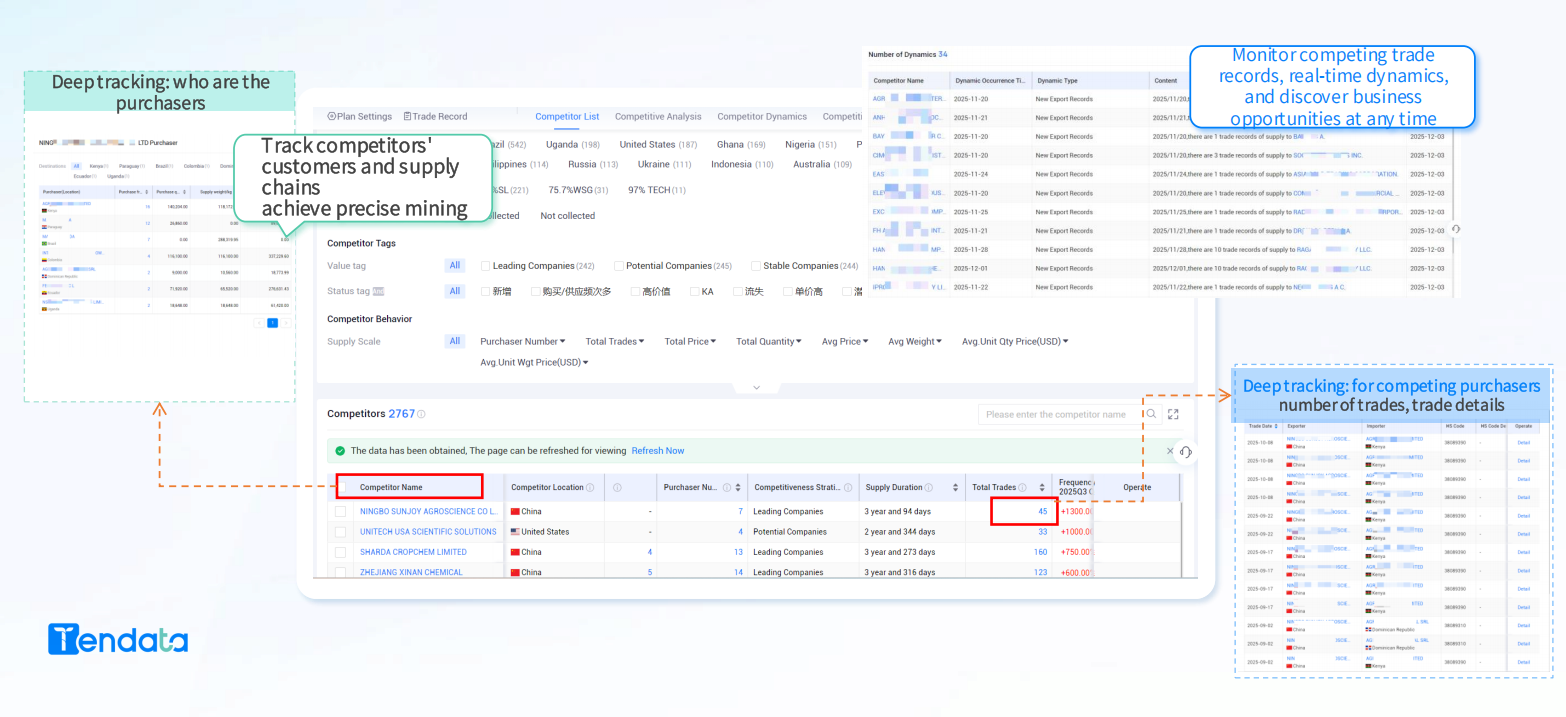
Tariffs often dominate discussions around international trade, but they are only one piece of a much larger puzzle. While many businesses fixate on duty rates, they miss the hidden currents that truly shape market potential: shifting consumer behaviors, regulatory changes beyond taxes, and the rise of digital ecosystems that bypass traditional barriers. A narrow focus on tariffs obscures the real story—that opportunity lies in the gaps between headline policies.
Untapped markets rarely announce themselves through conventional data. They emerge in the nuances: a region with high mobile penetration but low formal retail penetration, a demographic underserved by global brands but hungry for quality, or a local trend that hasn't yet scaled. Success comes from reading the signals that others overlook, whether it’s a surge in cross-border payment usage or a community-driven demand for sustainable goods. These are the opportunities that live beyond tariff schedules.
Companies that look past tariff tables and dive into the messy, human realities of new markets often find themselves with first-mover advantages that no trade agreement can replicate. It’s about stitching together localized partnerships, adapting to informal economies, and building trust where institutional frameworks are weak. In the end, the most resilient market entry strategies are woven from threads of cultural insight and operational agility—far removed from the blunt instrument of trade duties.
Risk-Proofing Supply Chains Through Real-Time Import Analytics
Supply chain disruptions rarely announce themselves in advance, but they nearly always leave digital footprints in trade data. Real-time import analytics capture these signals as they happen—port congestion spikes, sudden tariff shifts, or supplier shipment delays—allowing companies to pivot before minor hiccups become costly stoppages. Instead of relying on monthly reports that are outdated by the time they land on a desk, teams can monitor live dashboards that reflect the current state of customs clearances, vessel movements, and inventory flows. This shift from reactive problem-solving to proactive risk management is what separates resilient supply chains from fragile ones.
Beyond early warnings, real-time import data opens the door to smarter diversification strategies. When a key sourcing region shows signs of instability—whether political unrest, weather events, or regulatory changes—an analytics platform can instantly surface alternative suppliers that already meet compliance and quality standards, along with estimated lead times and landed costs. Procurement teams can then simulate scenarios, weighing trade-offs like air freight versus ocean freight, without ever touching a spreadsheet. This agility is especially critical in industries where margins are thin and customer tolerance for stockouts is zero.
The real game-changer, however, is when real-time analytics feed into automated decision-making. By setting predefined thresholds—say, a delay beyond 48 hours at a critical transshipment hub—systems can trigger contingency plans automatically, rerouting shipments, adjusting production schedules, or even triggering contractual clauses with backup suppliers. This not only reduces the manual workload on supply chain teams but also builds a self-correcting ecosystem that learns from each disruption, continuously refining risk models. As global trade becomes more volatile, the ability to act on live import intelligence will define which businesses thrive and which merely survive.
From Transactional Data to Strategic Gold: Transforming Insights into Action
Every sale, return, and cart abandonment leaves a digital fingerprint. Yet most companies treat that trail as little more than an operational ledger—something to be counted and filed. The real magic happens when you stop seeing rows of transactions and start reading patterns: which products cluster together in late-night purchases, how weather shifts reorder your top SKUs, or why a slight price tweak ripples through basket sizes weeks later. That’s the shift from logging what happened to understanding why it happened, and it’s the first step toward making data earn its keep.
The gap between insight and impact is where most strategies stall. A dashboard that reveals a dip in repeat purchases is just a warning sign unless someone has the authority to greenlight a re-engagement campaign that same afternoon. Forward-thinking teams are wiring their analytics directly into daily workflows—triggering personalized offers when a high-value customer’s engagement score slips, or auto-adjusting inventory allocations based on real-time buying signals from different regions. When you remove the human delay between noticing and doing, transaction data becomes a continuous feedback loop rather than a rearview mirror.
What separates the companies that thrive on their data isn’t fancier algorithms—it’s the habit of asking sharper questions. Instead of “What were sales last quarter?” they ask “Which customer micro-segments showed the highest responsiveness to our subject-line tests, and how can we clone that pattern across channels?” They treat each transaction not as the end of a story, but as a chapter that suggests the next move. Over time, this turns a static archive of receipts into a living map of customer intent, revealing opportunities that competitors—still drowning in spreadsheets—will miss entirely.
The New Geography of Trade: Mapping Import Dynamics Across Continents
Trade patterns are no longer dominated by a handful of established routes. Over the past decade, import dynamics have splintered and reconfigured across continents, driven by shifting manufacturing bases, regional trade agreements, and the need for supply chain resilience. The old model—raw materials flowing from the Global South to North, finished goods moving in reverse—has been overlain with a complex web of south-south connections and intra-regional exchanges that challenge simple narratives of globalization.
A closer look at import data reveals striking new geographies. Southeast Asian nations, for example, are importing more from each other than ever before, buoyed by integrated electronics and automotive supply chains. Meanwhile, Europe’s energy import map has been redrawn almost overnight, with pipelines and LNG terminals reorienting away from eastern corridors. Across the Atlantic, nearshoring has pushed up Mexico’s imports of intermediate goods from the United States, while Chinese manufacturers bypass tariffs by routing shipments through third countries, creating subtle but significant distortions in trade statistics.
These shifts demand a fresh approach to mapping import flows—one that captures not just volume but velocity, value concentration, and vulnerability. The new geography of trade is less about fixed points and more about corridors that pulse with seasonal demand, geopolitical shifts, and infrastructure bottlenecks. For policymakers and businesses alike, the key lies in moving beyond aggregate figures to visualize the layered, often hidden architectures that now define how goods cross borders.
Predictive Power: Forecasting Demand with Global Import Patterns
Global trade flows often reveal demand shifts long before they show up in domestic sales data. By tracking import volumes across key ports and commodity categories, businesses can spot emerging patterns tied to industrial growth, consumer preferences, or supply chain reconfigurations. A surge in semiconductor imports into a manufacturing hub, for instance, may hint at rising electronics production months ahead of official reports. This upstream visibility gives demand planners a unique edge: they can adjust procurement and capacity before competitors even sense the change.
Historical import data acts like a layered map of consumption habits. When analyzed alongside economic cycles, weather disruptions, or policy changes, these patterns expose both steady rhythms and sudden jolts. For example, pre-pandemic shipping records showed a consistent rise in medical equipment imports to certain regions, but the real forecasting value came from combining that trend with local demographic shifts and healthcare investments. Seasonality in apparel imports, meanwhile, often aligns with fashion calendars and cultural festivals, allowing for tight inventory alignment far earlier than relying on point-of-sale signals alone.
Translating these insights into actionable forecasts requires more than just looking at containers and tonnage. Smart companies blend import data with regional logistics data, supplier lead times, and even satellite imagery of warehouse buildup. Some have started using machine learning to weigh the significance of a sudden drop in raw material imports from a specific country, flagging potential production bottlenecks. Others monitor the mix of goods entering a port to infer a country’s shifting industrial focus. The result is a dynamic, forward-looking view of demand that turns global trade from a lagging indicator into a powerful predictive tool.
FAQ
At its core, it's the systematic examination of shipment records, customs declarations, and trade flows from across the globe. The value lies in transforming raw, often messy data into a clear picture of market demand, supply chain performance, and competitive pressures. Companies can no longer rely on intuition alone; this data reveals what products are actually moving, in what volumes, and at what prices, giving businesses a factual basis for strategic decisions.
They monitor shifts in part numbers, commodity codes, and sourcing geographies. For instance, a sudden spike in imports of a specific electronic component from a new supplier country can signal a technology shift or a gap in local production. By tracking such anomalies and gradual changes over time, companies can adjust procurement or R&D efforts long before trends become obvious news. It's about connecting the dots between seemingly unrelated trade flows to anticipate demand.
Beyond units and values, you can map supplier-buyer relationships, identify the exact ports and logistics routes being used, and infer pricing brackets from declared values. More subtly, you can detect seasonal patterns, the impact of regulatory changes, and the true market share of competitors by seeing whose products are landing in key markets. It often exposes the hidden middlemen in a supply chain or reveals unauthorized distribution channels.
The biggest pain is inconsistency: each country has its own HS code version, unit of measure, and data format. Cargo descriptions are often vague or deliberately obscured. Analysts spend a lot of time building cross-reference tables and using fuzzy matching algorithms to normalize company names and product categories. It's rarely a clean, automated process—it requires domain knowledge to know, for example, that 'spark ignition engine parts' in one dataset equals 'gasoline engine components' in another.
It allows companies to benchmark their own logistics performance against the market—seeing if their lead times and costs are competitive. More importantly, it helps identify alternative suppliers during disruptions by showing which other factories are already shipping similar goods to the region. You can also spot over-reliance on a single country or port and model risks by studying historical interruption data. It turns the supply chain from a reactive cost center into a proactive strategic asset.
It's not about crystal-ball predictions, but about probability modeling. When you see a consistent two-year cycle of rising imports for a capital good in a developing economy, combined with new trade agreements, you can reasonably forecast continued growth. Leading indicators, like a rise in packaging material imports often predict an upcoming surge in finished products. It's more pattern recognition than fortune-telling, but it gives companies a forward-looking edge in planning.
It's typically a mix of cloud-based data lakes, Python scripts for ETL, and graph databases for mapping relationships. Natural language processing is crucial for cleaning up cargo descriptions. Many teams use interactive visualization tools like Tableau or custom web apps to let non-technical users explore the data. The key is building a flexible pipeline that can ingest new country data monthly without breaking—it's as much about data engineering discipline as about any single tool.
It keeps everything in the public record: customs declarations are legal documents. By analyzing a competitor's import shipments, you can understand their production volumes, input materials, and sourcing strategies. You can see when they trial a new supplier or shift assembly to a different country. It's entirely above board because you're interpreting openly available data, similar to reading a company's earnings call transcript—just far more granular and real-time.
Conclusion
Global trade is no longer a black box of customs filings and shipping manifests—it’s a living map of economic intent, constantly reshaped by shifting demand, geopolitical pivots, and supply chain vulnerabilities. Import data, when properly decoded, reveals far more than what crossed a border: it exposes where consumer appetites are quietly spiking, which markets are stealthily diversifying their sources, and how regional blocs are re-aligning in real time. The traditional lens of tariffs and trade balances misses these deeper rhythms. By tracing the granular flow of goods—say, a sudden surge in semiconductor imports from Vietnam to Mexico, or a decline in European textile purchases from a specific province in China—analysts can spot early signals of industrial transformation that haven’t yet hit headline reports. This isn’t about hindsight; it’s about foresight. The new geography of trade is less about fixed hubs and more about fluid corridors, and those who map its import dynamics gain a predictive edge that static models simply can’t offer.
Turning transactional records into strategic gold demands moving beyond retrospective dashboards. The real power lies in real-time analytics that fuse import patterns with on-the-ground intelligence—port congestion data, political risk indicators, even weather disruptions—to build resilient procurement strategies. A brand that watches its key components’ import volumes dip across multiple suppliers can preempt a shortage before competitors even sense the tremor. Meanwhile, blending historical import trends with machine learning forecasts lets businesses ride demand waves, not chase them. But data alone is inert; it only becomes an asset when embedded into decision loops. The companies winning in this landscape aren’t just data-rich—they’re insight-driven, using import analytics to stress-test supply chains, negotiate with foresight, and pivot sourcing strategies in days, not quarters. In a world where trade routes can be rerouted overnight by sanctions, climate shocks, or sudden policy shifts, the ability to read import data as a strategic language is no longer optional—it’s the defining competency of globally competitive firms.
Contact Us
Contact Person: Grace
Email: [email protected]
Tel/WhatsApp: +86 18721992033
Website: https://www.tendata.com